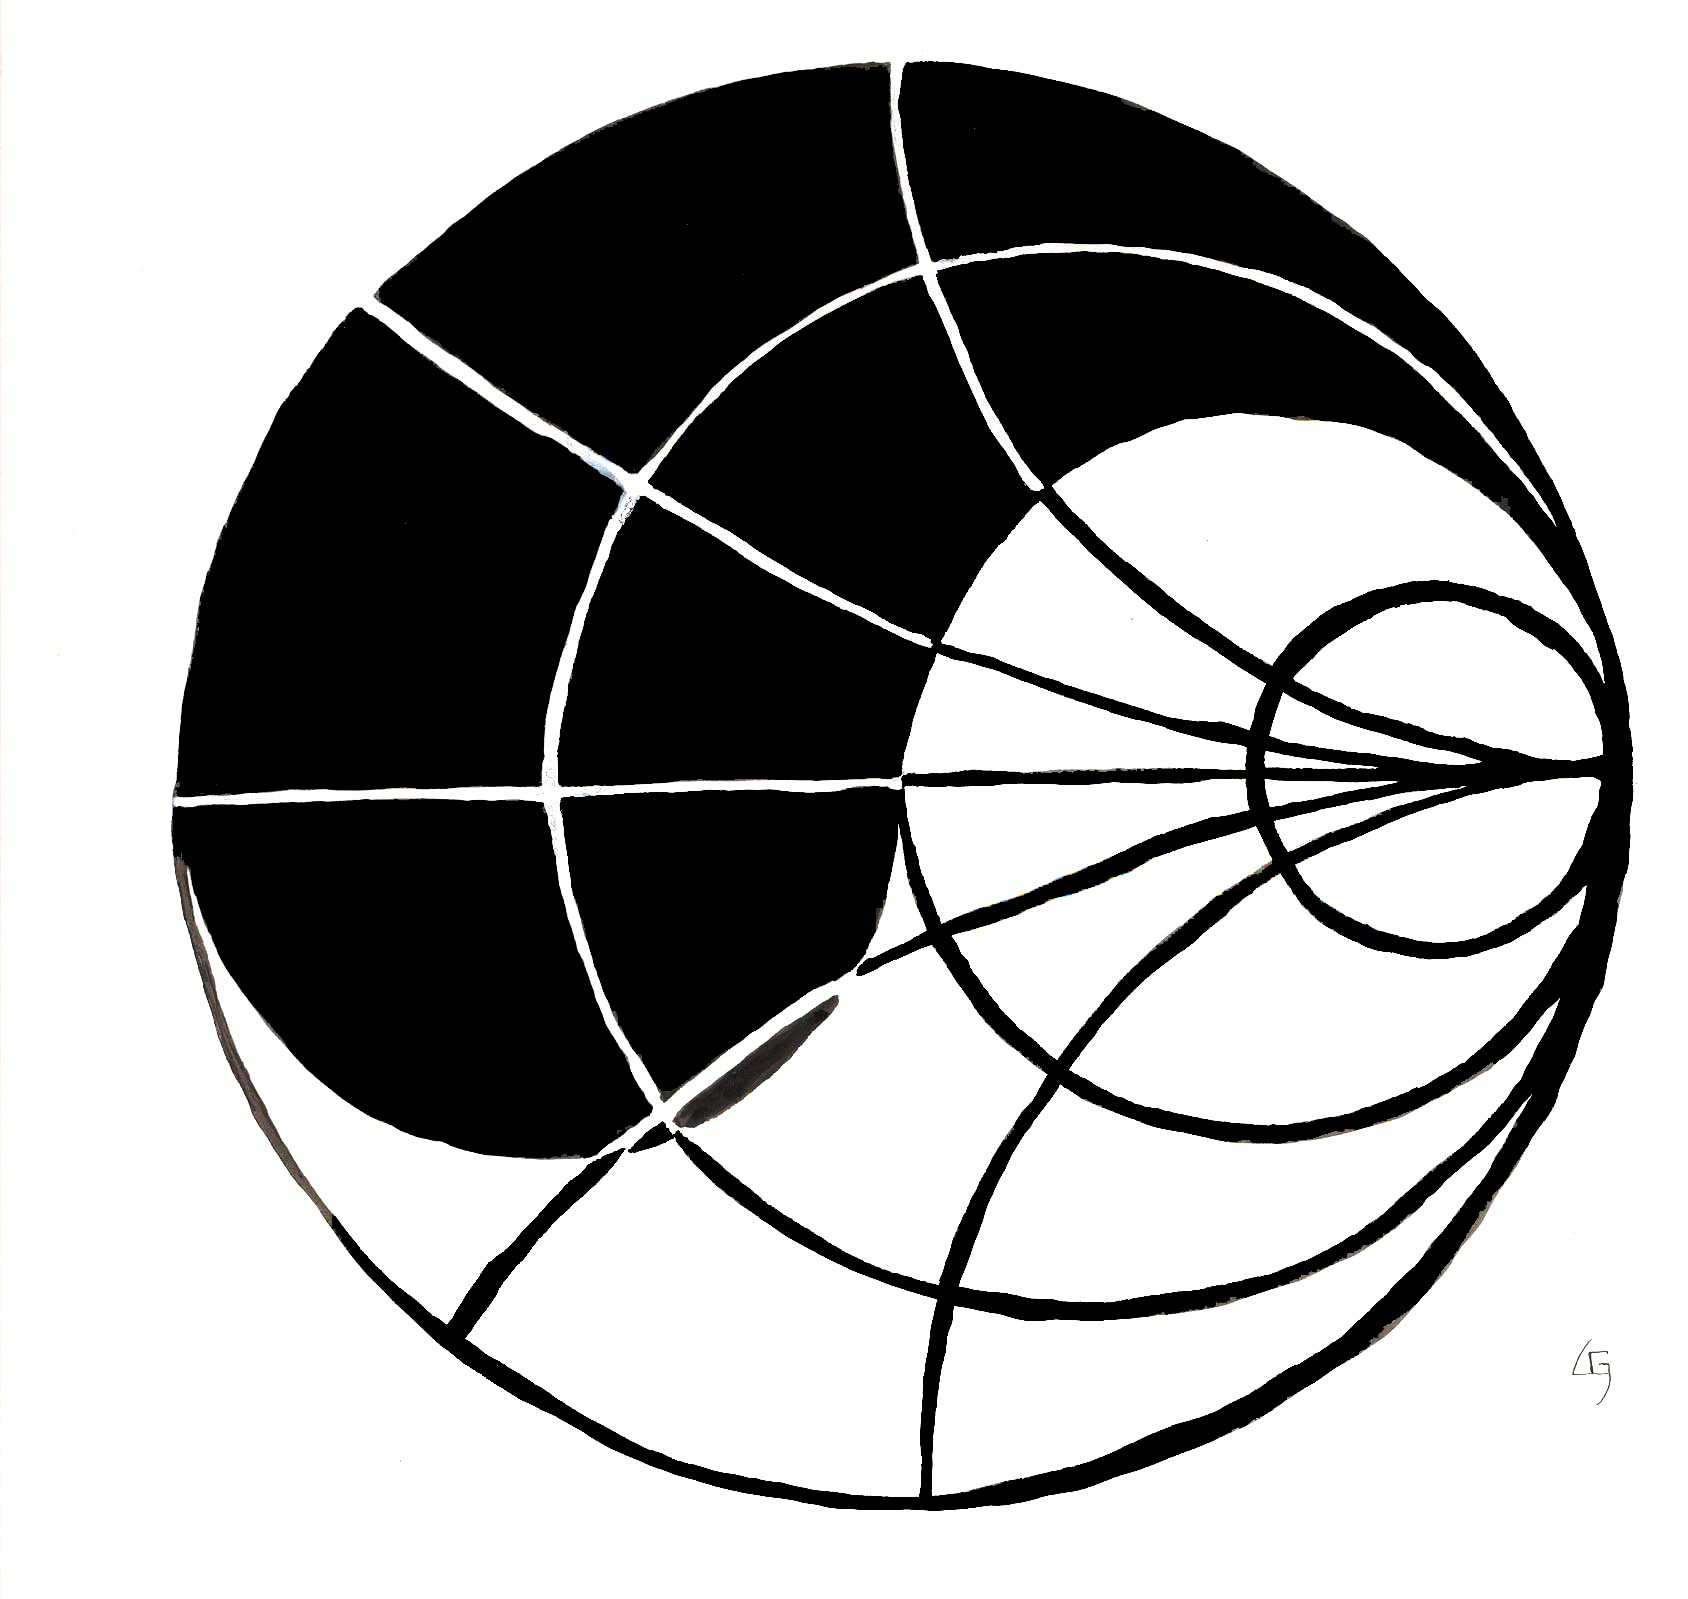
Pen and Ink of Yin-Yang Smith Chart
This was done while I was a graduate student at MIT studying Microwave Engineering. If I did this today it would have been done with something like Adobe Illustrator, but those programs did not exist in 1975 or 1976. The Smith Chart is used to plot amplitude and phase reflections of microwaves in complex coordinates. They were a thing of beauty to techno-nerds and I was quite expert at them.
Recent Posts
- Black Sea Bass
- Edwardian Bookworm
- Screaming Dragon
- Kunoichi
- Pineapple Love
- The Agony of Human Trafficking (black)
- Rhino
- The Blues Singer
- Moon Dancer
- The Agony of Human Trafficking
- First Ascent
- Nevertheless she persisted
- Nyx in Flight 2020
- Bacchanalian Swing
- Judith and Holofernes
- Hippo rising from the deep
- The Music Must Come Out
- Sheep may safely graze
- David
- Pen and Ink drawing of wine bottle label
- International Bull Market
- Dragon Games
- Al Dente
- Enlightenment
- Lion Head in Plaster of Paris
- Firstborn
- Not legal in California
- Lionheart, half man, half lion
- 3 minute sketch
- Earrings
- Pen and Ink of Yin-Yang Smith Chart
- Unity